Google Analytics – Part 10: Reporting
01/02/2017
Articles in this series:
- Part 1: The Fundamentals
- Part 2: Core Analysis Techniques
- Part 3: Conversion & Conversion Attribution
- Part 4: Creating A Measurement Plan
- Part 5: How Google Analytics Works
- Part 6: Key Metrics Dimensions Defined
- Part 7: Understanding Your Account Structure
- Part 8: Setting up filters
- Part 9: Using Goals
- Part 10: Reporting
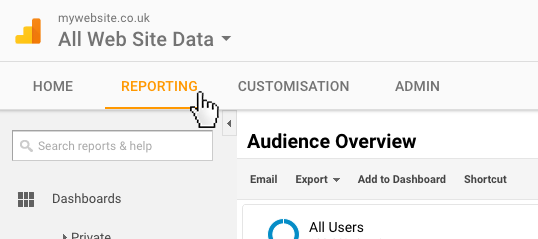
Audience Overview
Once logged in to your account, navigating to ‘Reporting’ in the menu bar will take you to the ‘Audience Overview’ page, which by default will provide a snapshot of your sessions (visits) over the past month. You can easily change this metric by clicking on the dropdown menu and selecting something else however (e.g. ‘Bounce Rate’ instead of ‘Sessions’). Additionally, you can view how two metrics correlate by selecting a second metric to compare with.
The date range can be easily changed using the date picker towards the top right hand of the page. This tool provides a terrific comparison feature that allows you to quickly compare the data with a different period of time, so you can easily check year-on-year or month-on-month performance at a 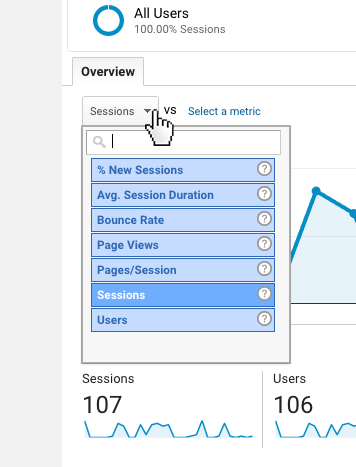 glance.
Data Tables
The majority of the reports you’ll find in Google Analytics are laid out in data tables. You can find an example of this if you navigate to the ‘Location’ page within the Audience > Geo menu.
If you scroll down the page you’ll see a standard data table displaying ‘Country’ as the primary dimension (for more on dimensions see Part 6: Key Metrics Dimensions Defined). You change the primary dimension very easily by simply selecting a different one from the options provided (e.g. ‘City’), or you can also introduce a secondary dimension to the data table using the dropdown menu, which can be very useful.
Acquisition & Behaviour Data
The ‘Acquisition’ and ‘Behaviour’ sections of your reports provide some of the most important and meaningful data in the whole of the Reporting area.
By navigating to the ‘Acquisition’ section, you can view data about where your traffic has originated from (e.g. from a search engine, a social media page, a referring website etc.) based on the date range selected. If you’ve already set up goals (see Part 9: Using Goals), then you can view a snapshot of your goal conversion figures here. Goals are a terrific way of defining and measuring key interactions on your website.
The ‘Behaviour’ section provides extremely useful data concerning what your visitors do when they’re on your website. By viewing the ‘Behaviour Flow’ page you can gain insight into the journey your visitors take from their entry point onto the website. This can be helpful to understand how the design, structure and content of your website is encouraging visitors to progress through the site. You may be encouraged by this resulting data if the journey visitors follow compliments your marketing goals, but you may also find this tool identifies issues where visitors aren’t arriving at the areas of the site you want them to. If this is the case, re-designing the entry points to your website (typically the homepage) to encourage traffic to your desired destinations can really help to address any such problem.
The ‘Site Content’ sub-section will compliment what you might have found interesting on the ‘Behaviour Flow’ page. Here you can view data concerning which pages receive the most traffic, which pages are your most popular landing pages (entry points to the website) as well as your exit pages (the last page visitors view before exiting your website), amongst other things.
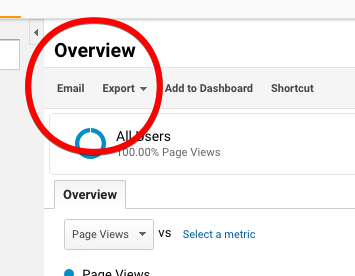 Exporting Reports
Two of the most useful features in the whole Reporting section are the ‘Email’ and ‘Export’ tools, that appear on every page. The ‘Email’ tool allows you send the data displayed on the current page (including any changes to the data range you may have made) to an email address in a variety of formats (CSV, Excel, PDF etc.). Additionally, you can schedule the email to be re-sent periodically with fresh data so you can track the progress of a specific report with minimal effort.The ‘Export’ tool provides the same export functionality seen in the ‘Email’ tool, but here you have the option to save the report to a location of your choosing on your computer.
Conclusion
Over the past few months in this series of blog posts we’ve looked at why businesses should use digital analytics tools to monitor the performance of their website and digital products. As explained in the first post of this series, websites should be seen as business tools, which like any tool, need to be continually sharpened to remain fit-for-purpose. Digital analytics tools such as Google Analytics are powerful tools that allow you to take control of the success of your website and make informed, evidence-based marketing decisions to achieve your business objectives. The best part about it is – Google Analytics is completely free!
If you’re interested in discussing Google Analytics further or how we can help improve the performance of your website, please get in touch with a member of the team today.